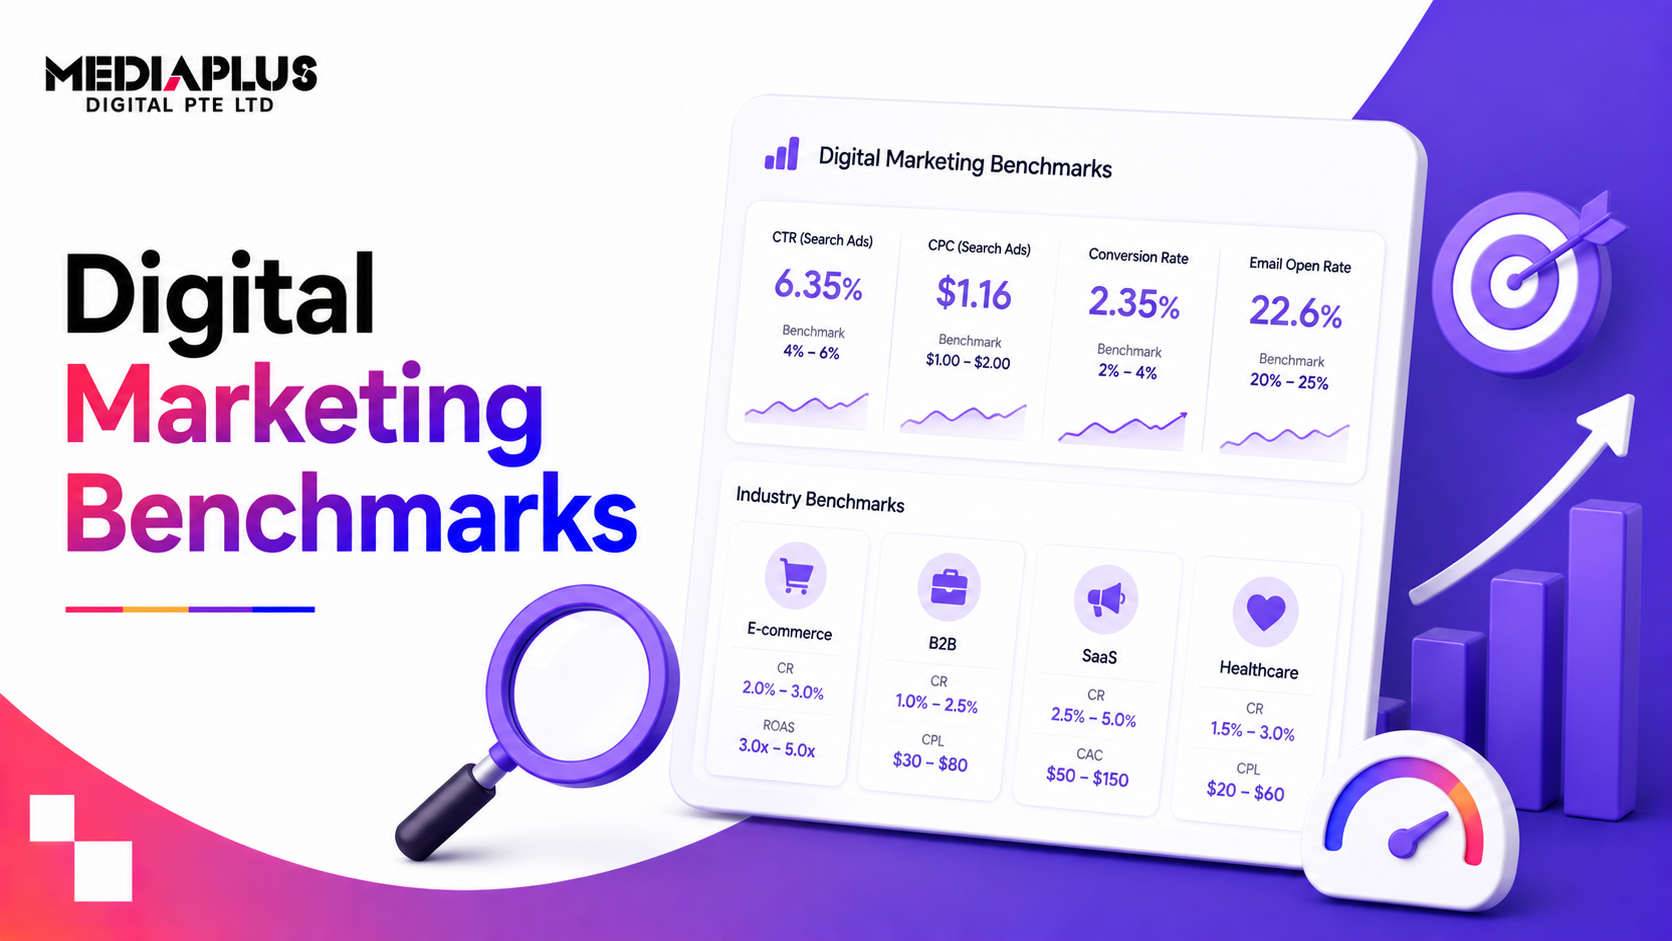
Quick answer: Digital marketing benchmarks are the average results (click-through rate, cost per click, conversion rate, cost per lead) that tell you whether your campaigns are performing. As a 2026 reference, Google Ads averages sit around a 6.6% CTR, a $5.42 CPC, and an 8.2% conversion rate, while Facebook Ads average roughly a 1.4 to 2.2% CTR and a 1.93x ROAS. Use these as a starting point, then compare to your own industry, since numbers vary widely.
A note on figures: the benchmarks below are global (largely US, in USD). Malaysian costs are usually lower in ringgit. Use them for direction and ratios, not exact targets, and read the Malaysia context section.
What are digital marketing benchmarks (and why they matter)
Benchmarks are the industry averages you measure your own performance against. They answer the question every marketer asks: is this good? Without them, a 3% conversion rate is just a number. With them, you know whether you are ahead of, or behind, your market, and where to focus.
Just remember two things: benchmarks vary hugely by industry, and they are a reference, not a goal. Your own historical performance is often the more useful comparison.
Google Ads benchmarks 2026
All-industry averages for Google Search Ads in 2026:
|
Metric |
2026 average |
|
Click-through rate (CTR) |
~6.6% |
|
Cost per click (CPC) |
~$5.42 |
|
Conversion rate (CVR) |
~8.2% |
|
Cost per lead (CPL) |
~$66.69 |
By industry, the spread is wide: – Highest CTR: Arts and Entertainment (over 12%), with Finance, Insurance, and Travel over 9%. – Lowest CPC: Arts and Entertainment (~$1.63) and Restaurants and Food (~$2.05). – Highest CPC: Attorneys and Legal Services (~$9.87), then Home and Home Improvement (~$8.33).
Two 2026 trends worth noting: – Conversion rates rose across about 87% of industries, up nearly 9% overall. – AI bidding now drives about 78% of Google Ads spend, and advertisers using it report roughly 22% lower cost per conversion than manual bidding. (See our guide to AI Max vs Performance Max.)
Facebook / Meta Ads benchmarks 2026
|
Metric |
2026 average |
|
CTR |
~1.4% to 2.2% |
|
CPC (traffic) |
~$0.70 |
|
CPC (lead gen) |
~$1.92 |
|
ROAS (median) |
~1.93x |
Meta CTRs are naturally lower than Search because the intent is different: people are scrolling, not searching. Judge social by ROAS and cost per result, not CTR alone.
Rough benchmarks for other channels
- Email marketing: open rates commonly 20 to 35%, click rates 2 to 5%, varying by list quality and industry.
- SEO / organic: the top organic result typically earns the largest share of clicks, with click-through falling sharply down the page. Organic’s value is cumulative rather than per-campaign.
- Landing pages: a “good” conversion rate is often cited around 2 to 5%, with the best pages higher.
Treat these as ballpark ranges; channel and industry change them a lot.
What good looks like: how to read benchmarks
- Compare within your industry, not the all-industry average. Legal and home improvement pay far more per click than food or entertainment.
- Compare to yourself over time. Beating your own last quarter matters more than hitting a global average.
- Look at the full funnel, not one metric. A low CTR with a high conversion rate can beat the reverse.
- Mind the currency. Global figures are in USD; your ringgit costs will usually be lower.
- Use ratios, not absolutes. CTR-to-conversion and cost-per-result travel better across markets than raw dollar amounts.
A Malaysia context
Malaysian ad costs are generally lower than the US benchmarks above. As a local guide, Google Ads CPCs commonly run around RM3 to RM6 for many SME categories, rising to RM8 to RM30+ in competitive sectors like legal, finance, and medical. The patterns hold, high-competition industries cost more, high-intent search converts better, but the ringgit numbers are lower than the global averages. Use global benchmarks for direction and your own account data for targets.
Frequently asked questions
What is a good CTR for Google Ads?
The 2026 all-industry average is around 6.6%, but it varies widely: some industries exceed 12%, others sit near 3 to 4%. Compare within your industry.
What is a good conversion rate?
Google Ads averaged about 8.2% in 2026, and landing pages often aim for 2 to 5%. It depends heavily on industry, offer, and traffic quality.
Are these benchmarks accurate for Malaysia?
They are global (mostly US, in USD). The patterns apply, but Malaysian costs in ringgit are usually lower. Use them for direction and your own data for targets.
How often do benchmarks change?
Yearly at least, and trends shift faster now with AI bidding. Treat any benchmark as a snapshot and re-check current data.
Should I aim to beat the benchmark?
Aim to beat your own past performance first, then your industry benchmark. A global average is a reference, not a goal.
The bottom line
Digital marketing benchmarks tell you whether your campaigns are healthy: roughly a 6.6% CTR and 8.2% conversion rate on Google Ads, and a 1.93x ROAS on Meta, as 2026 global references. Compare within your industry, watch the whole funnel, adjust for ringgit, and measure against your own trend. Benchmarks point the way; your own data sets the target.
Want campaigns that beat the benchmark? Talk to MediaPlus Digital about Google Ads and digital marketing, and claim a free RM300 consultation.